

I am generally behind the curve when it comes to the new hotness out there. Not sure what it is, maybe I am out of phase with the rest of the world, maybe just behind on my podcast listening or not really paying attention, so while everyone else has moved on to the next new hotness, I am hanging out in one-month-ago time and have enjoyed this thing called “Bashtop”
What is Bashtop and why do I care?
If you are a nerd about what your system is doing and like to see the numbers, charts graphs, etc, than Bashtop is going to be an application you absolutely adore. The little bits of information it gives you from CPU load, load average, and frequency is superb. The chart it produces on the CPU usage looks fantastic and really makes you wonder how they accomplished this when it is only in text mode. Truly a feat of terminal engineering!
Installation
Bashtop, at the time of writing, is not in the official repositories of openSUSE, but it is built by the Open Build Service and available from software.opensuse.org. Select the the appropriate version version of openSUSE for you and use the “one-click” installation button to get going.
https://software.opensuse.org/package/bashtop
Alternatively, check out this resource for other Linux Distributions:
https://github.com/aristocratos/bashtop
Features
Bashtop provides a very easy to digest, visually appealing overview of what various aspects of your system is doing, this is very similar to htop but in a more aesthetically pleasing presentation.

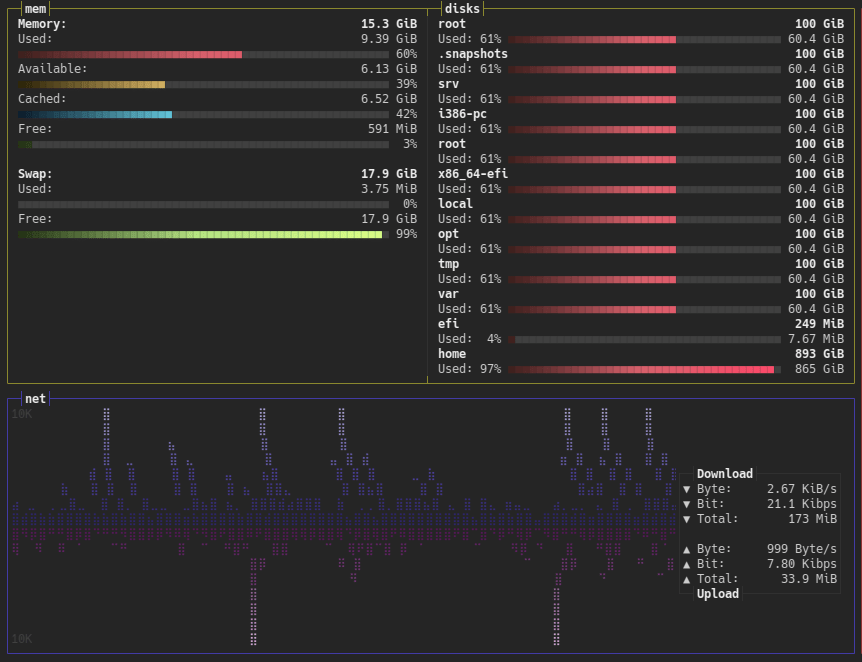
This gives you a quick snapshot of your CPU, Memory, Disks, Network activity and processes. Essentially, all the core bits of interesting information about what the computer is doing. In my case, I have a 4 core/8 thread CPU where I am given the CPU information, frequency and load per core as well as temperature.

The lower-left section shows you memory usage, disk usage and network activity. The graphs look great with the gradient coloring. Not sure how they pull this off but they pull it off well.
The processes table is great. should you need to filter the processes, just press “f” and start typing to find the application for which you are searching. It is that simple and easy to use.

Bashtop has a fantastic Menu of options and if you weren’t paying close attention, you might not realize that this is all in text mode. The way the larger font of “Options,” “Help,” and “Quit” look, you might be deceived into thinking that this is invoking some kind of fancy graphical mode.

Though I have left the options at default, you may wish to tweak some of the options. The default_black theme works well for me and the update interval is fine at 2800 ms. I would change the clock if my system default wasn’t 24hr, which, I don’t know why everyone doesn’t adopt 24hr.

The key take away here with the menu is that it is very user friendly, no squirrelly commands need to be typed in the terminal when launching Bashtop to get it just as you would like.
The “Help” menu item give you your key command list with an explanation of what each key sequence does. It’s nice to see that there are alternates as well.

Depending on what you are trying to extract from your system monitoring, this can come in handy. Especially so when terminating processes that have gone rouge. The Help screen provides a great snapshot of capabilities right in this application to make system management a more satisfying task.
What I Like
Although it is a text display, it uses some less commonly seen ASCII characters to give the impression of it being a graphical display. This really gives the impression of a very modern looking and feeling application that could be misconstrued as a graphic user interface.
The layout of the application is well done and a good usage of screen real estate. The CPU graph at the top is the right choice for the first thing your eyes pan down. The graph combined with the immediate state of the CPU is a nice touch. The rest of the information, Memory usage, Disk Usage, Network activity with graph and the process list fill out the bottom nicely.
The menu system in Bashtop is top notch. Once you have it tweaked out to your preferences, you probably won’t use it as much but the “help” screen is also very informative. I know that I can’t always remember what keystrokes do what so the help is great for a guy like me that doesn’t use it day in and day out.
What I Don’t Like
As compared to top or htop It is a bit heavier on resources than htop and top, though I think it is worth every byte and CPU cycle, just for the overall visually satisfying experience. I can see the arguments as to why some don’t like to use bashtop but this isn’t something I keep running continually, just when I want to nerd out and see what’s going on.
This is not a big deal and it may change in the future, but Bashtop is not in the official openSUSE Leap or Tumbleweed repository. Setting it up is easy to do with the one-click installation process on software.openSUSE.org.
Final Thoughts
I have historically made htop my go-to terminal system monitoring application. I still think htop is good but I happen to enjoy the experience of Bashtop just a bit more. It feels more like a full fledged product as opposed to a terminal application. If you like such technical information, I highly recommend installing and trying bashtop. I believe you will really enjoy it.
I have been informed, today, that there is yet another system resource application to try in the terminal called bpytop. That means, more relishable application exploration is on the horizon! Linux and open source software is so much fun!
References
Bashtop from software.opensuse.org
Bashtop from Github
Leave a Reply